Vehicle Data for Fraud Prevention & Telematics
Project Context
Our team sought to evaluate the market demand and prioritization of potential telematics-related solutions for North American fleet operators.
One key hypothesis: a fraud prevention feature—similar to our Secure Fuel solution—would rank among the top two most valued offerings.
The broader context involved testing seven possible solutions:
Fraud prevention
Savings alerts
Cost modeling
Predictive maintenance
Route optimization
Dynamic fleet routing
Emissions reporting
The research aimed to:
Measure interest in each solution.
Force rank them to assess relative importance.
Explore customer expectations around fraud prevention specifically—features, pricing, and impact on retention.
My Role
I served as the UX Research Lead on the project, responsible for:
Translating product hypotheses into a testable research plan.
Designing and scripting a remote, unmoderated survey with branching logic.
Aligning the research with product and business objectives.
Coordinating recruitment for both current and prospective customer segments.
Delivering survey to Telematics director for at-the-ready survey once technology is in place.
Research Methodology
Approach:
Remote, unmoderated survey using structured questions and randomized feature presentation.
Why this method?
Needed speed and scalability to reach two distinct segments.
Ability to control question flow and logic without live facilitation.
Quantitative ranking combined with qualitative input to provide both breadth and depth.
Audience:
20 participants split across:
Current customers (recruited via company email outreach).
Prospective customers (via UserTesting’s panel).
All participants were North American business owners or fleet managers with active commercial fleets.
Incentives:
Current customers: Amazon gift cards.
Prospective customers: Incentivized by UserTesting participation fees.
Research Process
Questionnaire Design
Developed demographic and fleet-profile screening to ensure qualified participants.
Crafted randomized feature presentation to mitigate order bias.
Incorporated branching logic for fraud-related follow-ups.
Recruitment
Current customers sourced via internal lists.
Prospective customers sourced from UserTesting.
Targeted balance across fleet sizes and vehicle classes.
Data Collection
Unmoderated testing platform.
~10–12 minutes for optimal completion rates.
Analysis
Quantitative: Score and ranked solution interest.
Qualitative: Thematic analysis of open-text responses for feature expectations and current fraud mitigation approaches.
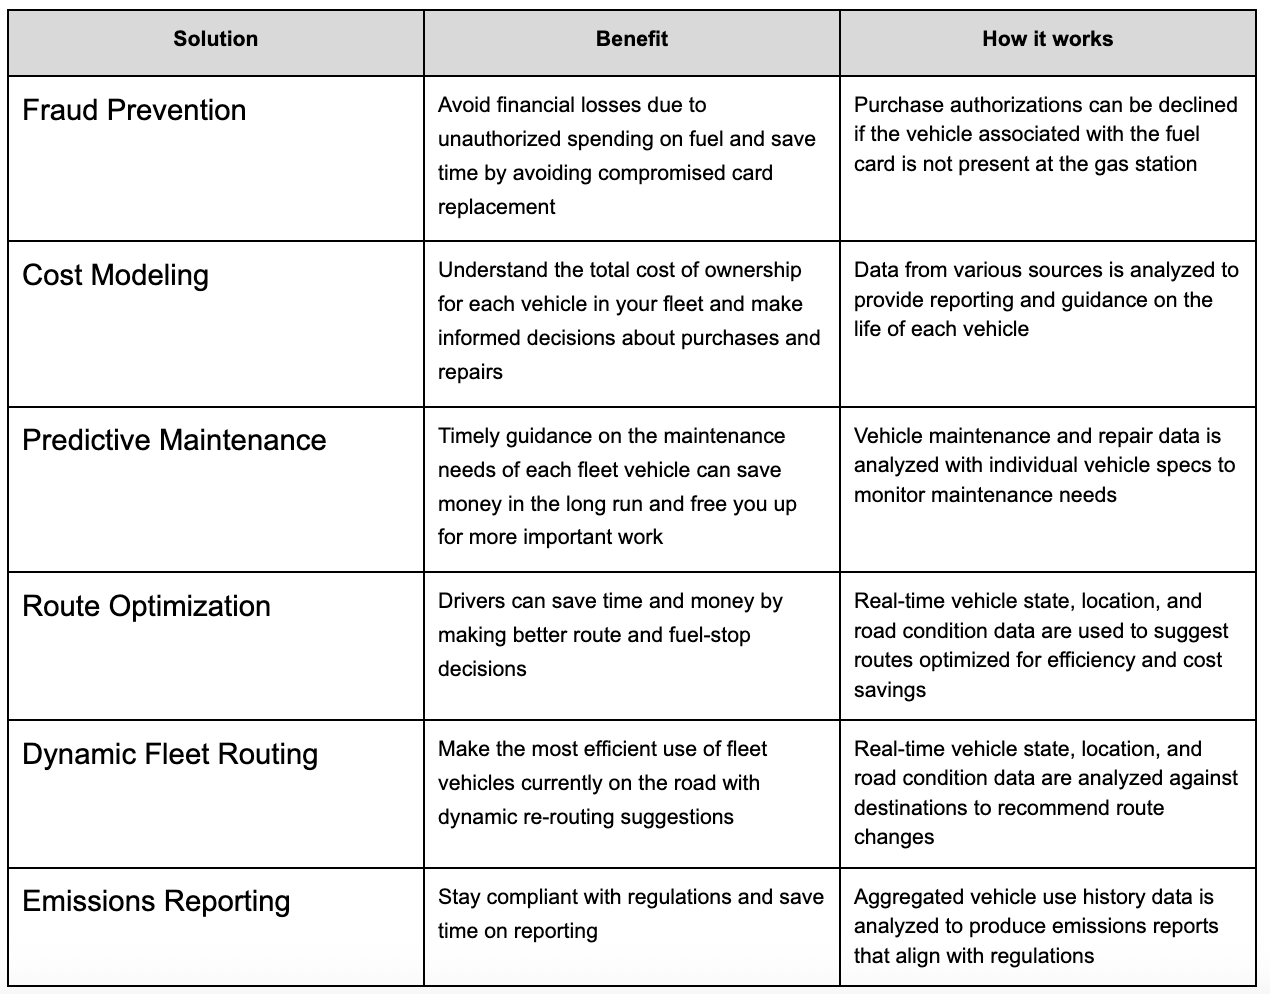
Solution Comparison Chart
Hypothesized Outcomes
We expect Fraud Prevention to be ranked consistently in the top two solutions across both current and prospective customer segments.
We expect high interest centered on real-time monitoring and automated alerts as must-have features.
We expect a high percentage of respondents want driver-level controls, including the option to decline suspicious transactions.
We expect respondents to be split roughly in half in their willingness to pay:
Some expected it as an included feature.
Others open to an add-on model depending on perceived value and cost.
We expect fraud to be an extreme concern by the majority of respondents, with varied current mitigation methods—ranging from in-house tools to outsourced services.
Deliverables
Check out the Survey Script here with branching logic and randomized feature presentation.
Feature Expectation Matrix for fraud prevention.
Reflections
What I’d do differently:
Increase sample size for stronger statistical confidence in segment differences.
Incorporate a short follow-up interview round to deepen understanding of decision-making.
Test messaging variations for fraud prevention to see how framing impacts prioritization.

