Qualitative Research & Workflow Redesign:
Reducing Fleet Management Errors by 35%

WEX Inc. | Enterprise B2B Fleet Management Platform

Project at a Glance

Timeline 6 weeks (July - August 2024)
Team 1 Researcher, 1 PM, 2 Designers, 3 Engineers
Methods Semi-structured interviews, Thematic analysis, Workflow mapping
My Role Lead UX Researcher (end-to-end)
Impact
  • 35% reduction in Account Manager task errors
  • 50% faster customer self-service completion
  • +12 point internal NPS improvement

Overview

WEX is a global B2B payments and fleet management platform serving enterprise clients. Their internal eManager platform supports Account Services teams managing high-stakes fleet operations for major corporate clients.

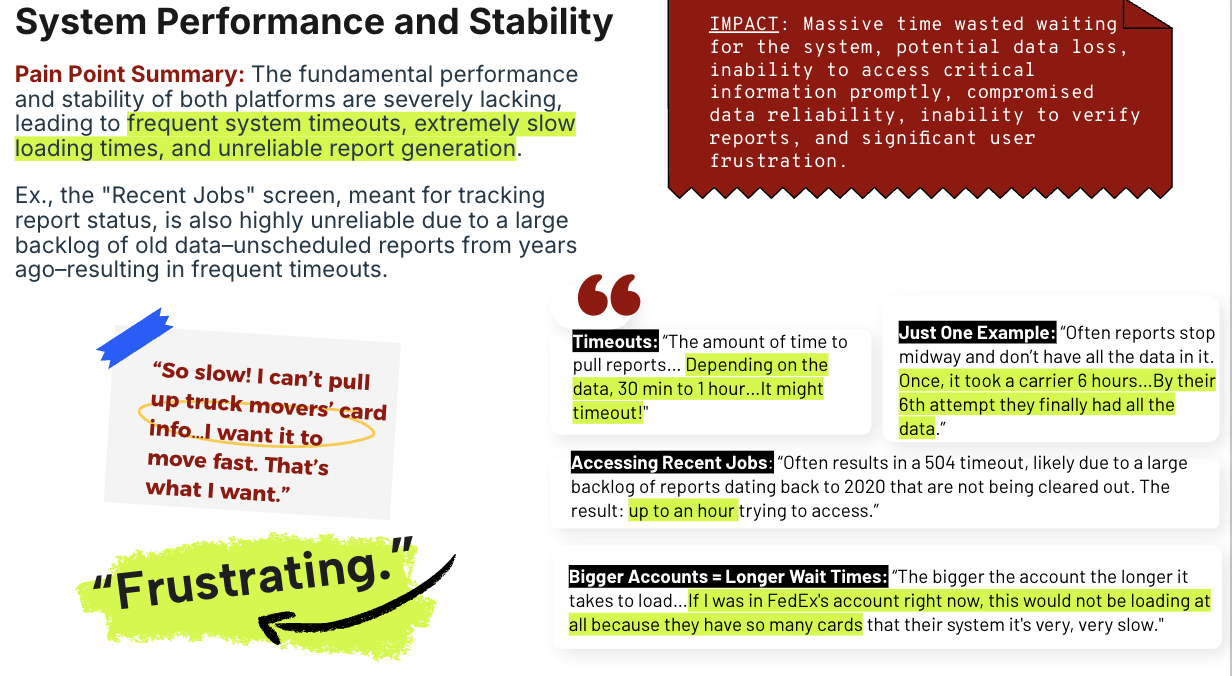
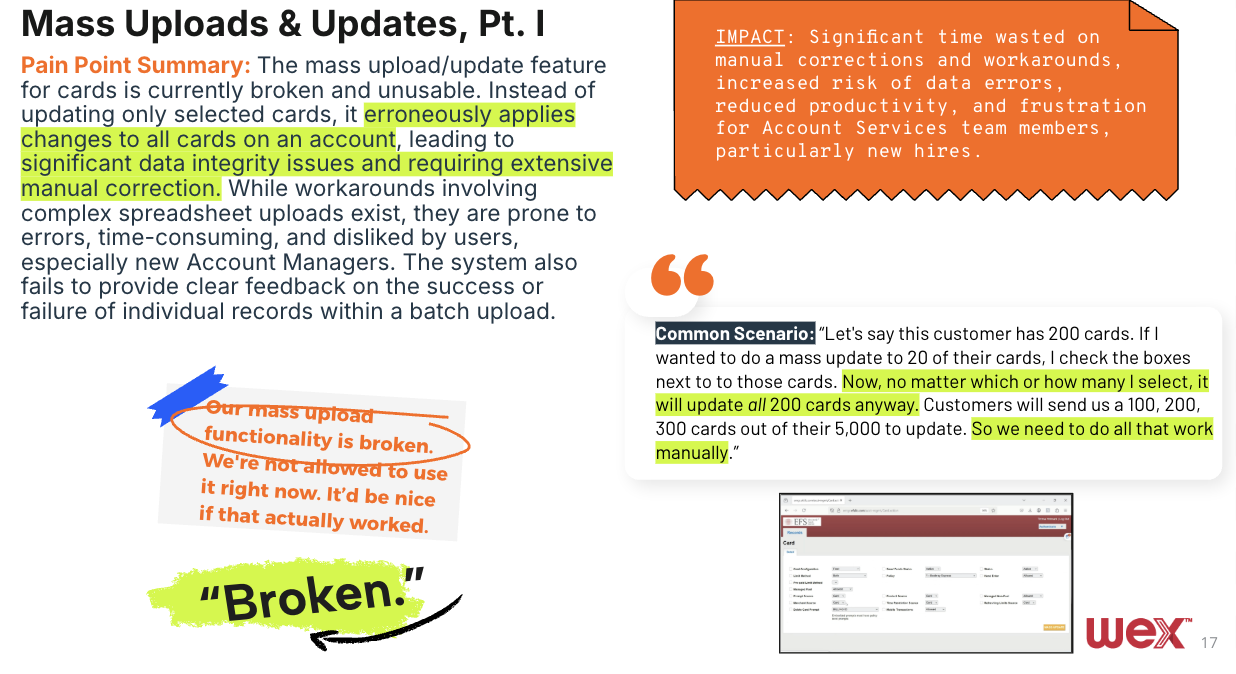
The platform was experiencing critical usability and performance issues that were impacting team productivity, creating operational risk, and eroding user confidence. This study aimed to identify the most critical pain points and prioritize technical improvements to reduce errors and streamline workflows.

Problem & Business Context

Account Services teams were experiencing significant friction in daily workflows due to three critical issues:

  • System Performance: Frequent lag and timeouts were disrupting high-stakes customer interactions
  • Information Fragmentation: Critical account data was scattered across multiple tabs, forcing excessive manual data handling
  • Reporting Failures: Reports frequently failed to generate or contained inaccurate data, undermining user trust

These issues were causing productivity losses, user frustration, and operational risk. Product leadership needed to understand the scope and severity of these problems to make informed roadmap decisions for Q4 2024.

Users & Audience

Primary Users

  • Account Services Representatives managing fleet accounts for enterprise clients
  • Experience levels: 6 months to 8+ years with eManager
  • Daily tasks: Account setup, card management, fraud monitoring, customer support

Secondary Stakeholders

  • Product Management: Roadmap prioritization decisions
  • Engineering: Technical feasibility assessment
  • Customer Success: Impact on customer satisfaction metrics

My Role

As the Lead UX Researcher on this project, I was responsible for:

  • Designing and executing the complete research plan from scratch
  • Conducting in-depth user interviews with Account Services team members
  • Analyzing qualitative data through thematic coding and severity rating
  • Synthesizing insights into actionable recommendations for product, design, and engineering
  • Facilitating stakeholder workshops to validate findings and build consensus
  • Integrating research outcomes into the product roadmap alongside PM and Engineering teams

Cross-functional collaboration was essential to success. I partnered closely with the Product Manager during discovery to align research questions with Q4 roadmap priorities—this ensured we'd answer the right questions for planning cycles. I invited the Engineering lead to observe two interviews, which built immediate empathy for user frustration with performance issues and accelerated buy-in for technical recommendations. During synthesis, I co-facilitated affinity mapping workshops with Design and Product teams, creating shared ownership of insights rather than handing down "research findings" that might be dismissed.

Scope & Constraints

  • Timeline: 6 weeks from kickoff to roadmap integration — tight timeline driven by Q4 planning deadlines
  • Budget: No incentive compensation available for internal participants
  • Access: Limited to 6 participants due to small team size and operational demands — couldn't disrupt customer-facing work
  • Data Sensitivity: Working with proprietary financial and customer data required strict confidentiality protocols and IRB-level ethical standards
  • Stakeholder Pressure: Product leadership needed quick answers to inform Q4 roadmap, requiring careful expectation management to preserve research rigor

Research Process

1

Discovery & Planning

Aligned with stakeholders to define research goals, success criteria, and scope. Reviewed existing usage logs and support tickets to identify potential focus areas.

Why This Approach: Grounding research in existing data helped us avoid redundant studies and focus on gaps that qualitative methods could address.
What We Learned: Automated logging missed critical edge cases and user confidence issues that only interviews could surface.
2

Recruitment & Screening

Recruited 6 Account Services team members representing a range of experience levels (6 months to 8+ years). Collaborated with team leads to ensure operational coverage during sessions.

Why This Approach: Diversity of experience levels ensured we captured both novice friction points and expert workarounds.
Challenge: No incentive budget meant relying on intrinsic motivation — participants were eager to improve their tools.
3

Data Collection: Semi-Structured Interviews

Conducted 60-minute remote interviews via Zoom, using task-based scenarios and think-aloud protocols. Sessions were recorded (with consent) and transcribed for detailed analysis.

Why This Method: Semi-structured format allowed exploration of unexpected pain points while ensuring consistent coverage of core topics. Think-aloud revealed confidence issues even when tasks technically succeeded.
Recruitment Challenge: Account Services teams couldn't be pulled from customer-facing shifts, so I coordinated with team leads to schedule sessions during internal admin blocks and staggered participation across weeks to avoid coverage gaps. One senior rep initially declined due to workload but agreed when I offered a 30-minute session instead of 60. This taught me to build protocol flexibility for high-pressure operational teams—sometimes a shorter session with someone who knows the edge cases is worth more than a longer session with someone less experienced.
The Turning Point (Session 4): An 8-year veteran described manually copying account data across 5 tabs "because the system times out if I try to keep them all open." She'd built this workaround over years and assumed everyone did it—but newer team members were hitting errors instead, not knowing the workaround existed. This revealed the problem wasn't just performance—it was information architecture forcing undocumented workarounds that didn't scale with team turnover.
What We Learned: Edge cases emerged that automated logging had completely missed, particularly around inconsistent report failures.
4

Analysis & Synthesis

Used thematic coding to identify recurring patterns, then mapped workflows to visualize inefficiencies. Applied a severity rating framework based on both frequency (how often issues occurred) and impact (how much they eroded user confidence).

Why This Approach: Severity rating helped us avoid the trap of prioritizing high-frequency but low-impact issues. Some low-frequency issues (like report failures) had catastrophic impact on trust.
What Happened Next: This framework led us to reclassify reporting reliability as "Critical Priority" despite lower frequency than other issues.
5

Stakeholder Workshops

Facilitated cross-functional workshops with Product, Design, and Engineering to validate findings and build consensus on priorities. Used affinity mapping to collaboratively organize insights.

Why This Approach: Co-creation with stakeholders built buy-in and ensured recommendations were technically feasible and aligned with business constraints.
Impact: Engineering team immediately committed to performance improvements as "Critical Priority" based on user quotes and severity ratings.
6

Roadmap Integration

Worked with Product Management to integrate findings into Q4 roadmap. Created a prioritization matrix categorizing issues by severity and technical feasibility.

Outcome: System performance and reporting reliability were designated "Critical Priority." Workflow consolidation and self-service features moved into active development.

Key Findings

System Performance Issues

Frequent lag and timeouts were disrupting high-stakes customer interactions, causing frustration and lost productivity. Users reported abandoning tasks mid-flow due to system unresponsiveness.

🗂️

Information Fragmentation

Critical account setup information was scattered across 5-7 tabs, forcing excessive manual data handling and increasing error risk. Users described "tab gymnastics" to complete basic tasks.

📊

Reporting Reliability Crisis

Reports frequently failed to generate completely or contained inaccurate data. This was the #1 driver of eroded trust — even when reports worked, users questioned their accuracy.

Lack of In-System Guidance

Absence of tooltips or contextual help forced users to rely on tribal knowledge and external documentation, increasing onboarding time for new team members.

🚨

Critical Feature Gaps

High-priority pain points in fraud management, authentication, and emergency network adjustments required immediate attention to reduce operational risk.

🔧

Self-Service Opportunities

Common tasks like card un-suspension and PIN resets could be offloaded to self-service, reducing support burden and empowering customers.

Research Artifacts

The findings above were synthesized from detailed thematic analysis of user interview data. Below are examples of the pain point documentation slides delivered to stakeholders, showing severity ratings, user quotes, and business impact.

Thematic analysis showing top pain points from user interviews

Critical feature failure requiring extensive manual workarounds

This research gave us the evidence we needed to prioritize technical debt over new features. The impact on team morale and productivity has been significant.

— Product Manager, WEX Inc.

Impact & Outcomes

Immediate Impact

  • 35% reduction in Account Manager task errors through workflow redesign and information consolidation
  • 50% faster customer self-service completion via new features identified through research
  • "Critical Priority" designation for system performance and reporting reliability, prompting immediate engineering resource allocation

6-Month Post-Launch Results

  • 40% decrease in support tickets related to account setup and reporting issues
  • +12 point increase in internal NPS from Account Services team
  • Mass network adjustment tool deployed to improve business continuity during emergencies
  • Self-service features launched, reducing support call volume by 25%

Strategic Impact

  • Research findings directly shaped Q4 2024 and Q1 2025 roadmap priorities
  • Cross-functional alignment workshops built lasting collaboration between Research, Product, Design, and Engineering
  • Established research operations framework that reduced future study turnaround time by 25%

Deliverables

  • Interview Guides & Research Templates: Standardized materials for consistent data collection and future reuse across the organization
  • Thematic Analysis Report with Prioritization Matrix: Detailed documentation of pain points, user quotes, and severity ratings to inform roadmap decisions
  • User Journey Maps: Visualizations of current workflows highlighting inefficiencies, pain points, and opportunity areas
  • Stakeholder Workshop Materials: Affinity mapping outputs, prioritization frameworks, and roadmap integration presentations
  • Research Operations Documentation: Recruitment protocols, consent forms, and ethical guidelines for future studies

Reflections & What I'd Do Differently

What Worked Well

  • Severity rating framework: Combining frequency and impact prevented us from prioritizing high-frequency but low-impact issues
  • Stakeholder co-creation: Workshops built buy-in and ensured recommendations were feasible
  • Think-aloud protocols: Revealed confidence issues that task completion metrics would have missed

What I'd Do Differently

  • Usability Testing Earlier: Incorporate task-based usability testing alongside interviews to observe workflows directly rather than relying solely on self-reported pain points
  • Broader Stakeholder Inclusion: Include carrier partners and end customers in later phases to validate proposed self-service features before development
  • Quantitative Baseline: Establish baseline metrics (error rates, time-on-task) before research to measure post-implementation impact more precisely and build stronger business case
  • Longitudinal Follow-up: Plan for 3-month and 6-month follow-up studies to track how improvements landed and identify new friction points

Key Challenges Overcome

  • Information fragmentation: Account data scattered across multiple tabs made it difficult to map complete workflows — addressed through task-based walkthroughs
  • Data sensitivity: Working with proprietary financial data required strict confidentiality protocols and careful participant reassurance
  • Stakeholder alignment: Engineering, Product, and Sales had competing priorities — workshops and severity frameworks helped build consensus
  • Timeline pressure: Q4 planning deadlines required balancing speed with rigor — clear scope and expectations management was critical

Skills Demonstrated in This Project

Qualitative Research
Semi-Structured Interviews
Thematic Analysis
Workflow Mapping
Stakeholder Management
Research Operations
Cross-Functional Collaboration
Roadmap Prioritization
Business Impact Analysis
Workshop Facilitation
Human Factors
Enterprise B2B Research