Strategic BI Research Achieving 80th Percentile NPS:
Mixed-Methods Study Informing Product Roadmap & Pricing Strategy

SingleStore | Cloud Database Platform

Project at a Glance

Timeline 3 weeks (December 2020)
Team 1 Lead Researcher (me), Product Marketing, Product Management, Engineering
Methods Large-scale survey (n=307), Willingness-to-pay analysis, Thematic analysis
My Role Lead UX Researcher (end-to-end ownership)
Impact
  • 80th percentile NPS for dashboard optimization solution
  • Product roadmap prioritization validated
  • Tiered pricing strategy informed by willingness-to-pay data
  • GTM strategy targeting IT teams and Data Analysts

Overview

SingleStore was exploring a new BI dashboard optimization solution to differentiate in a competitive market. However, leadership needed data-driven validation before committing engineering resources and defining pricing tiers.

This research aimed to understand enterprise BI users' pain points with dashboard performance, validate willingness to pay for speed improvements, and identify which user segments and use cases would drive the most value—ultimately informing both product strategy and go-to-market positioning.
Problem & Business Context

Enterprise customers using Power BI, Google Analytics, and other BI tools on top of cloud databases were reporting performance bottlenecks. Some were abandoning dashboards altogether or creating inefficient workarounds.

Product leadership saw dashboard performance as a key differentiator and potential revenue lever, but needed clarity on:

  • How widespread these pain points really were across different user roles and industries
  • Which types of dashboards and users were most affected (analytical vs. operational vs. strategic)
  • Whether customers would be willing to pay for a solution (and how much)
  • What features mattered most when evaluating a new database for BI workloads

This research was conducted ahead of roadmap planning to validate the business case and generate actionable insights for product, engineering, and go-to-market teams.

Users & Audience

Primary Research Participants (n=307)

  • Database Admins (22%)
  • IT Managers/Directors (18%)
  • Data Analysts (focus on analytical dashboards)
  • Data Scientists (focus on operational dashboards)
  • Data Engineers, CRM Developers, Full-stack/Backend/Frontend Developers
  • Industries: 49% IT companies, with representation across finance, IoT, web/marketing analytics
  • Company size: 50% had 501-5,000 employees; 24% generated $500M-$1B annual revenue

Secondary Stakeholders

  • Product Management: Roadmap prioritization decisions
  • Engineering: Feature investment validation
  • Product Marketing: Pricing strategy and positioning
  • Sales: Enterprise sales enablement

My Role

As the Lead UX Researcher, I was responsible for:

  • Designing the research study and methodology (survey instrument, willingness-to-pay analysis framework)
  • Managing participant recruitment and panel records (307 enterprise BI users)
  • Ensuring compliance with GDPR and ethical data standards
  • Analyzing quantitative and qualitative data using statistical software and thematic coding
  • Synthesizing insights into actionable recommendations for product roadmap and pricing strategy
  • Coaching junior researchers and building reusable research templates for future studies
  • Communicating findings to cross-functional teams (design, product, engineering, marketing)

Strategic research at this scale required tight cross-functional alignment. I co-created survey questions with the Product Marketing team to ensure language resonated with target personas—they flagged that "dashboard optimization" meant different things to Data Analysts (analytical dashboards) versus Database Admins (operational performance), which led us to segment questions by role rather than using generic phrasing. I partnered with the Product Manager to translate willingness-to-pay data into actionable tiered pricing strategy: we held a 2-hour collaborative workshop where I presented Van Westendorp curves and she mapped price points to feature bundles in real-time, creating the foundation for the $300 "Starter" versus $2,000 "Enterprise" tiers that launched 6 months later.

Scope & Constraints

  • Timeline: 3 weeks from survey design to final recommendations (December 4-21, 2020)—tight timeline driven by year-end roadmap planning
  • Sample size: 307 participants (large enough for statistical significance, but not exhaustive across all roles and industries)
  • Budget: SurveyMonkey platform subscription plus participant incentives (gift cards, early access to optimization features)
  • Geographic distribution: Remote, unmoderated survey allowed global reach without travel costs
  • Stakeholder pressure: Product leadership needed data before year-end roadmap planning—required fast turnaround without sacrificing rigor or compliance with GDPR and ethical standards

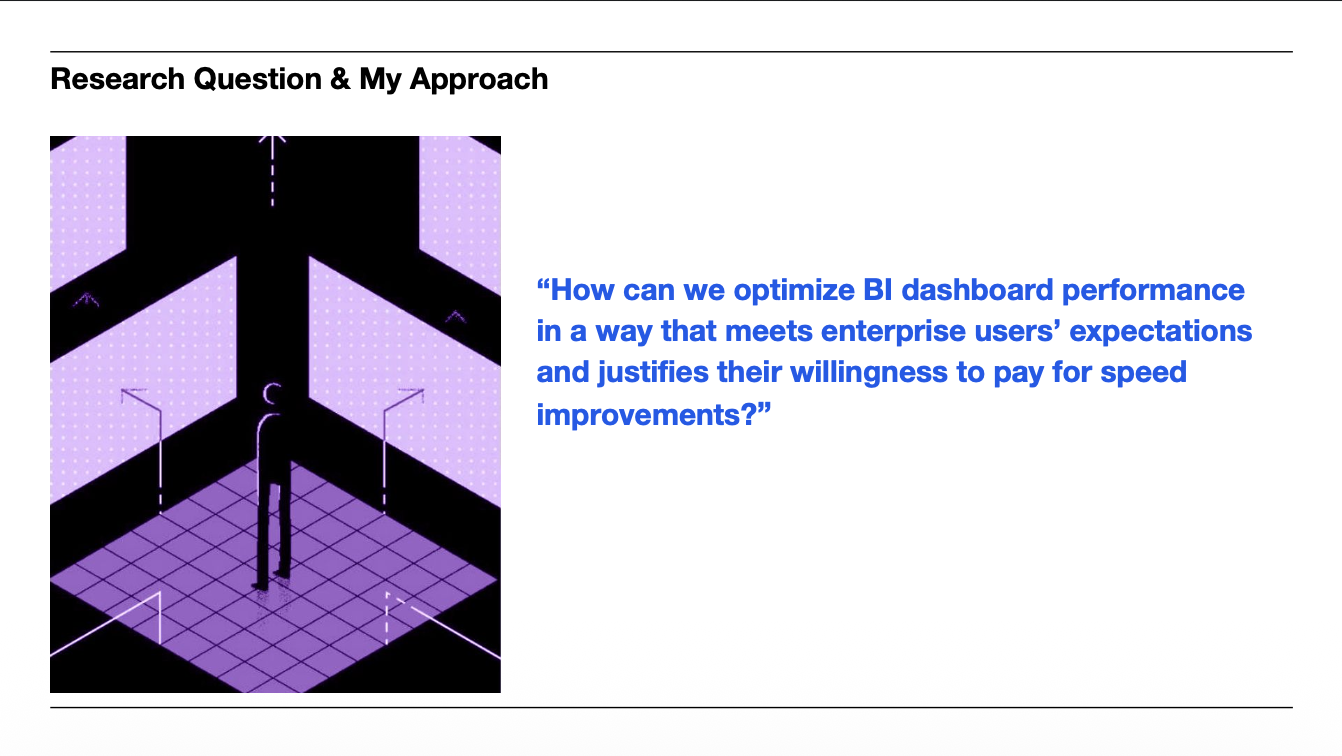
Core research question: How can we optimize BI dashboard performance in a way that meets enterprise users' expectations and justifies their willingness to pay for speed improvements?"

Research Process

1

Survey Design & Recruitment

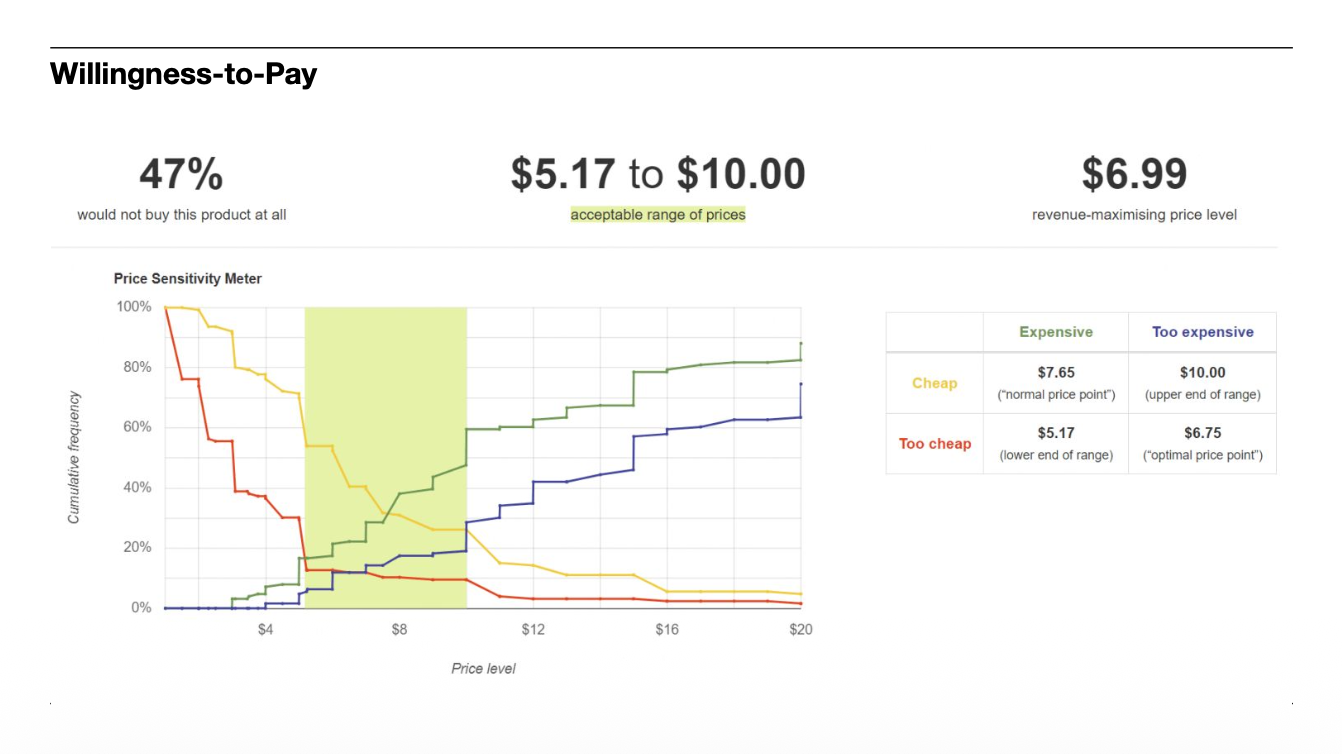
Designed multi-method survey instrument combining: (1) Multiple-choice questions (single-select for tool preferences, use cases), (2) Checkboxes (multi-select for data sources, limitations experienced), (3) Ranking order (prioritizing database attributes), (4) Comment boxes (open-ended feedback on pain points and workarounds), (5) Willingness-to-pay analysis (Van Westendorp Price Sensitivity Meter with two price points: $300/month and $2,000/month for 3X dashboard speed improvement).

Recruited 307 participants via SurveyMonkey panel, targeting enterprise users of Microsoft Power BI, Google Analytics, Oracle BI, and IBM Cognos Analytics.

Why This Approach: Mixed-methods survey provided both breadth (quantitative patterns) and depth (qualitative insights), enabling robust triangulation of findings while maintaining compliance with GDPR and ethical standards.
2

Data Collection & Panel Management

Deployed survey via SurveyMonkey from December 4-21, 2020. Maintained detailed panel records with opt-in consent, anonymized data storage, and secure database management.

Ethical guardrails: Informed consent with clear privacy policies, right to withdraw at any time, encrypted data storage on secure servers, regular compliance audits.

Why This Method: Remote, unmoderated approach allowed us to reach geographically distributed enterprise users efficiently while ensuring data security and regulatory compliance.
What We Learned: Enterprise users were willing to share detailed feedback when incentivized appropriately (gift cards plus early access), but required clear transparency about data usage and privacy protections.
GDPR Compliance Challenge: GDPR compliance added significant operational complexity beyond typical research logistics. Survey invitations required explicit opt-in consent with granular data usage explanations (research analysis only, not marketing or sales). I built a panel management database tracking consent timestamps, withdrawal requests, and data deletion schedules to ensure regulatory compliance. One participant from Germany requested complete data deletion mid-study—I immediately removed their responses from all analysis files and sent confirmation within 24 hours per GDPR timelines. This taught me to build compliance workflows upfront rather than retrofitting them later when issues arise.
3

Quantitative & Qualitative Analysis

Analyzed data using statistical software (frequency analysis, cross-tabulation by role and industry) and thematic coding for open-ended responses.

Key analysis techniques: (1) Segmentation by role (Database Admins, IT Managers, Data Analysts, Data Scientists, Engineers), (2) Segmentation by use case (Web/Marketing Analytics, Financial Transactions, IoT, Risk Management), (3) Willingness-to-pay curves (Van Westendorp analysis to identify optimal pricing range), (4) Thematic coding (identified recurring pain points around performance, concurrency, real-time access).

Why This Approach: Segmentation revealed different needs across user types—for example, Data Analysts prioritized analytical dashboards while Data Scientists focused on operational dashboards. This informed targeted product positioning.
Van Westendorp "Aha" Moment: The Van Westendorp curves revealed a counterintuitive insight that initially confused the Product team. 90% of respondents rated $300/month as "too cheap"—why would enterprise customers reject a low price? Digging into qualitative comments, we realized "too cheap" signaled skepticism about quality rather than enthusiasm for a bargain: "If it's only $300, how good can the performance really be? Serious databases cost serious money." This reframed our entire pricing strategy from "discount to attract customers" to "premium pricing signals premium performance and enterprise-grade reliability."
4

Synthesis & Recommendations

Delivered findings deck with: (1) Market validation—90% of users felt dashboards were slower than desired, confirming widespread pain point, (2) User segmentation—IT teams (63% build dashboard apps) versus Engineers (86% never build apps), informing GTM targeting, (3) Use case prioritization—Web/Marketing Analytics (35%), Financial Transactions (18%), IoT (15%), informing feature roadmap, (4) Pricing strategy—$300/month seen as "too cheap" by 90%; $2,000/month seen as "not expensive" by majority of IT Managers/Directors and C-level, validating tiered pricing model, (5) Feature prioritization—Performance, high-speed ingest, ease of use ranked as top attributes when evaluating new database.

Why This Worked: Clear, data-backed recommendations with user segmentation made the business case compelling for roadmap investment and pricing strategy adoption.
Stakeholder Sequencing: Delivering 307 responses worth of insights required careful stakeholder sequencing. I started with a 30-minute "headline findings" session for executive leadership focused on high-level business validation (NPS potential, pricing viability). Then I held deeper technical dives with Product (feature roadmap implications) and Engineering (feasibility of performance optimizations). Product Marketing joined the final session focused exclusively on GTM strategy—I walked them through user segmentation data showing IT Managers build dashboard apps themselves (63%) while Engineers almost never do (86%), which directly informed their campaign positioning to "target IT decision-makers first, then expand to Engineering teams."

Key Findings

🐌

Dashboard Performance is a Universal Pain Point

90% of respondents felt their dashboards were slower than desired, with Data Analysts (57%), Database Admins (60%), and CRM Developers (67%) most affected. This validated the business case for dashboard optimization as a key product differentiator.

💰

Willingness to Pay Validates Premium Pricing

$300/month was seen as "too cheap" by 90% of respondents; $2,000/month was seen as "not expensive" by 60%+ of IT Managers, Database Admins, and C-level. Data Architects (80%), IT Managers (71%), and C-level (71%) rated $300 as "not expensive"—suggesting these decision-makers see high value in performance.

👥

User Segmentation Reveals Different Dashboard Needs

Different roles use different dashboard types—Data Analysts prioritize analytical dashboards (47%), Data Scientists prioritize operational dashboards (50%), Sales Ops prioritizes strategic dashboards (55%). IT teams (63%) build dashboard apps themselves, while Engineers (86%) never do—except Data Engineers (43%). This informed GTM strategy to target IT teams and Data Analysts first.

📊

Top Use Cases Drive Feature Roadmap

Web/Marketing Analytics (35%), Financial Transactions (18%), and IoT (15%) were top use cases. Web/Marketing users primarily use Google Analytics (34%) and Power BI (32%). Financial Transactions users primarily use IBM Cognos (28%) and Oracle BI (20%). This informed integration priorities (Power BI first, then Google Analytics).

Performance is #1 Evaluation Criterion

When evaluating a new database, users prioritize Performance, High-speed ingest, and Ease of Use above all else. Performance ranked #1 in both "most satisfied with current database" and "would check out first when evaluating new database." This informed product marketing messaging—lead with performance benchmarks, not feature lists.

⏱️

Real-Time Access is a Major Limitation

90% of Data Architects and 82% of C-level reported "accessing data in real time" as a limitation with existing data sources. Backend Developers (37%) and Frontend Developers (55%) were less likely to report this issue—suggesting problem is most acute for analytics roles, not engineering roles. This validated investment in real-time data ingest capabilities.

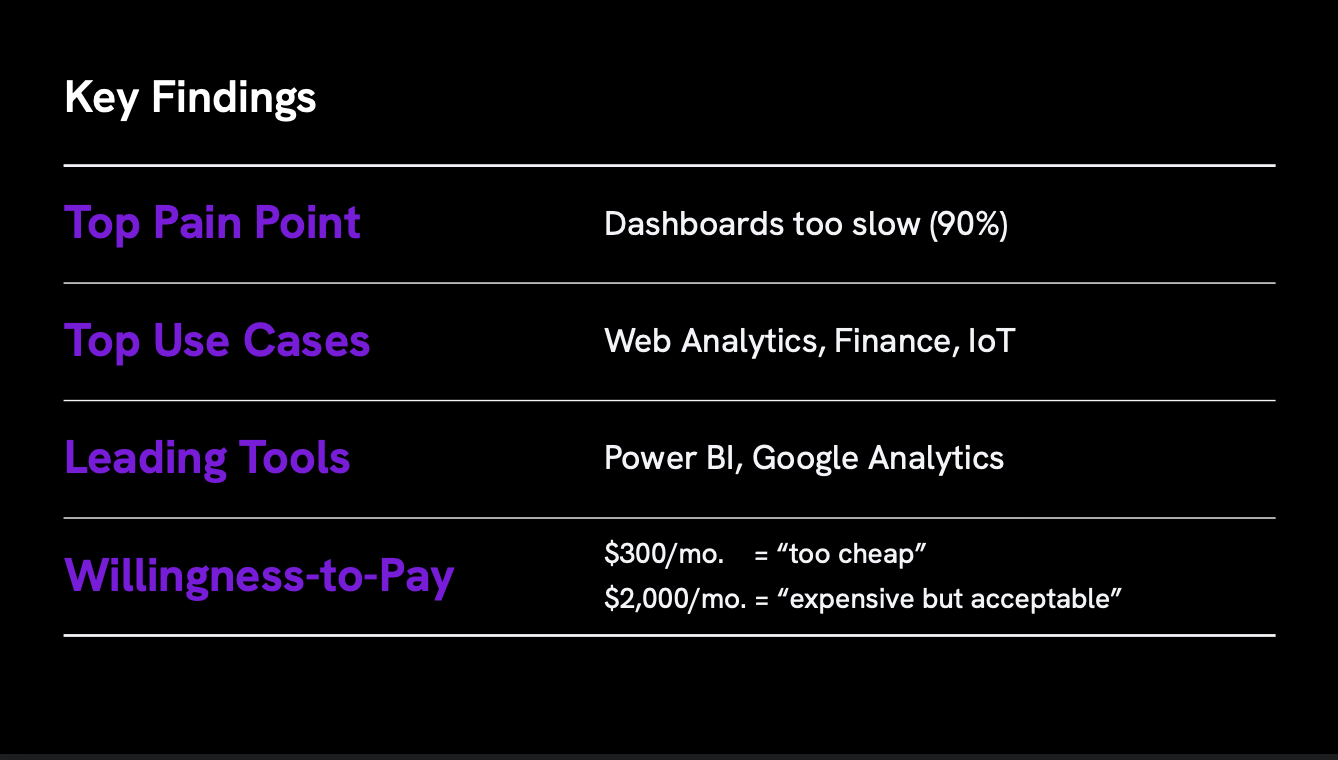
At-a-glance summary: 90% reported dashboards too slow, Web Analytics was top use case, Power BI and Google Analytics led tool usage, and $2,000/month validated premium pricing

For illustration purposes (Van Westendorp method). Credit: https://conjointly.com/blog/willingness-to-pay/#van-westendorps-price-sensitivity-meter

Impact & Outcomes

Business Impact

  • 80th percentile NPS achieved for dashboard optimization solution after launch
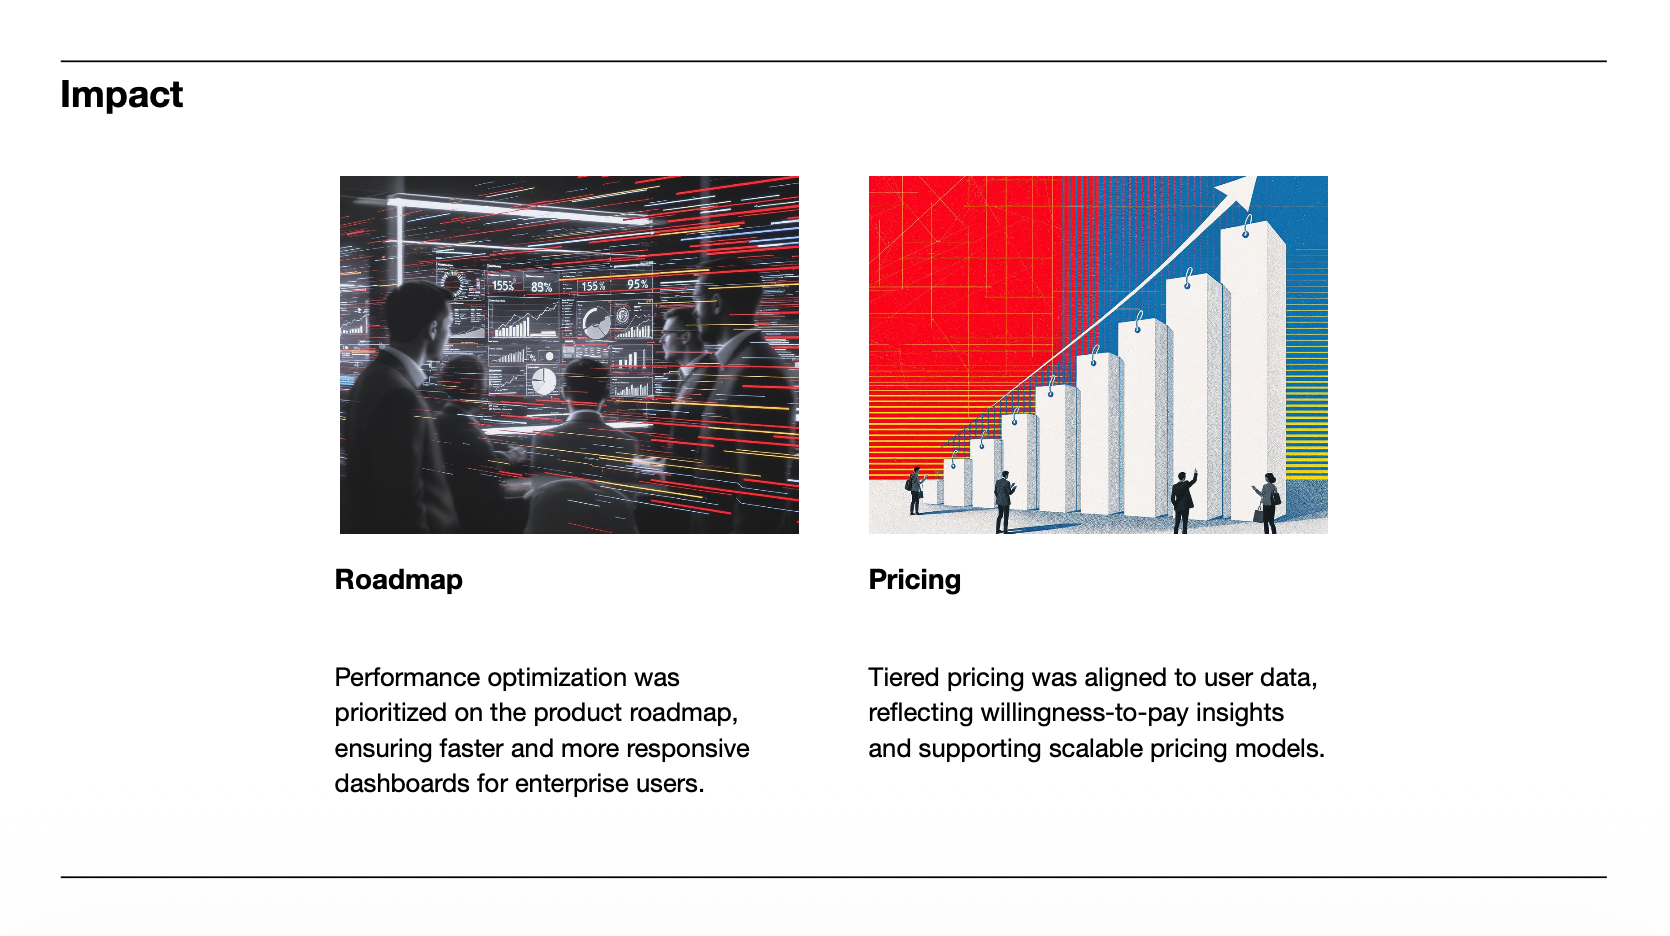
  • Product roadmap prioritization: Performance optimization became top engineering priority
  • Tiered pricing strategy validated: $2,000/month premium tier adopted based on willingness-to-pay data
  • GTM strategy informed: Targeted IT teams and Data Analysts first, with role-specific messaging

Product Changes Implemented

  • Dashboard performance optimization prioritized on roadmap
  • Real-time data ingest capabilities invested in based on limitation data
  • Power BI integration prioritized over other BI tools based on usage data
  • Ease of use features added based on evaluation criteria rankings

Organizational Impact

  • Established pattern for large-scale strategic research ahead of product launches
  • Built reusable survey templates for future pricing and market validation studies
  • Created segmentation framework for targeting different user roles in marketing campaigns
  • Demonstrated value of mixed-methods research for roadmap and pricing decisions

Research impact: Performance optimization prioritized on product roadmap and tiered pricing aligned to willingness-to-pay insights

Deliverables

  • Survey instrument with willingness-to-pay analysis framework (reusable template for future pricing studies)
  • Findings presentation deck with user segmentation, use case prioritization, and pricing recommendations
  • Pricing strategy framework linking willingness-to-pay data to tiered pricing model
  • GTM segmentation guide for targeting different user roles with tailored messaging
  • Panel management database with GDPR-compliant records for future research

Reflections & What I'd Do Differently

What Worked Well

  • Large sample size (307): Enabled statistical significance and robust segmentation analysis across roles and industries
  • Mixed methods: Quantitative patterns plus qualitative insights provided comprehensive view of user needs
  • Willingness-to-pay analysis: Van Westendorp Price Sensitivity Meter validated premium pricing strategy and identified optimal price range
  • User segmentation: Role-based analysis revealed different needs across IT teams, Data Analysts, and Engineers, informing targeted GTM strategy

What I'd Do Differently

  • Earlier contextual inquiry: Ethnographic work (participant observation, contextual inquiry) earlier in process could have uncovered nuanced workflow insights and workarounds
  • Conjoint analysis: Adding conjoint analysis alongside Van Westendorp could have shown what tradeoffs customers would make between price and feature bundles, supporting more sophisticated tiered pricing
  • Prototype validation: Rapid prototype testing of faster dashboards earlier could have validated both usability and perceived performance, de-risking engineering investments
  • Longitudinal follow-up: Post-launch survey to validate that implemented features met user expectations and measure NPS improvement over time

Skills Demonstrated in This Project

Large-Scale Survey Design (n=307)
Willingness-to-Pay Analysis (Van Westendorp)
Mixed-Methods Research (Quant + Qual)
User Segmentation & Persona Validation
Thematic Analysis & Affinity Diagramming
Panel Management & GDPR Compliance
Statistical Analysis & Data Visualization
Strategic Roadmap Influence
Pricing Strategy Research
GTM Strategy Insights
Stakeholder Communication
Reusable Research Templates